1 Transcriptome
Acceptable/excellent quality metrics:
| Metric | Acceptable | Excellent | Note |
|---|---|---|---|
| Median genes per cell | ≥ 500 | 1K - 5K | |
| Median reads per cell | ≥ 20K | 30K - 50K |
|
| Median UMI counts per cell | ≥ 1K | 5K - 30K | 过低可能导致基因间表达量差异太小,细胞间基本无法做聚类。 |
| Fraction of mitochondrial gene-associated UMIs | ≤ 20% | ≤ 10% | 过高可能多为濒死细胞或核裂解过度。 |
| Reads mapped to genome | ≥ 85% | ≥ 95% | 过低可能是基因组选择错误或文库污染。 |
| Reads mapped confidently to genome | ≥ 70% | ≥ 80% | 唯一比对(MAPQ=255)。 |
| Reads mapped confidently to transcriptome | ≥ 40% | ≥ 60% | |
| Reads mapped confidently to exonic regions | ≥ 40% | ≥ 50% | 最好 ≥ 60%。 |
| Reads mapped confidently to intronic regions | ≤ 30% | ≤ 20% | 细胞核样本可能高达 40% - 50%。 |
| Reads mapped confidently to intergenic regions | ≤ 10% | ≤ 5% | |
| Reads mapped antisense to gene | ≤ 10% | ≤ 5% |
Clusters characterized by poor quality control (QC) metrics—such as high percent.mt, low nCount_RNA, and low nFeature_RNA—are strong indicators of low-quality or dying cells. A key feature of these artifactual clusters is the co-expression of marker genes from multiple, often disparate, cell types. This phenomenon is particularly confounding when these clusters non-specifically express genes that are already prevalent across most other clusters. These widespread genes are likely derived from ambient RNA contamination in the cell suspension. It is therefore critical to distinguish these low-quality “background” clusters, whose mixed expression profile is an artifact, from bona fide cell clusters that legitimately express those same markers.
如果在你的数据集中,Mito/Ribo 基因不存在生物学意义,为了在 call cells 步骤得到 healthier cells,我们可以基于 raw_feature_bc_matrix,先移除 Mito/Ribo 基因,使得 broken cells 和 empty droplets 难以区分,再利用 DropletUtils 重新 call cells。
Tools used to model and remove ambient RNAs: SoupX, decontX, scAR, CellBender.
Installation of CellBender:
conda create -n cellbender -c conda-forge python=3.11
conda activate cellbender
pip install --no-cache-dir -U git+https://github.com/broadinstitute/CellBender.git@4334e8966217c3591bf7c545f31ab979cdc6590d
1.1 3’ transcriptiome
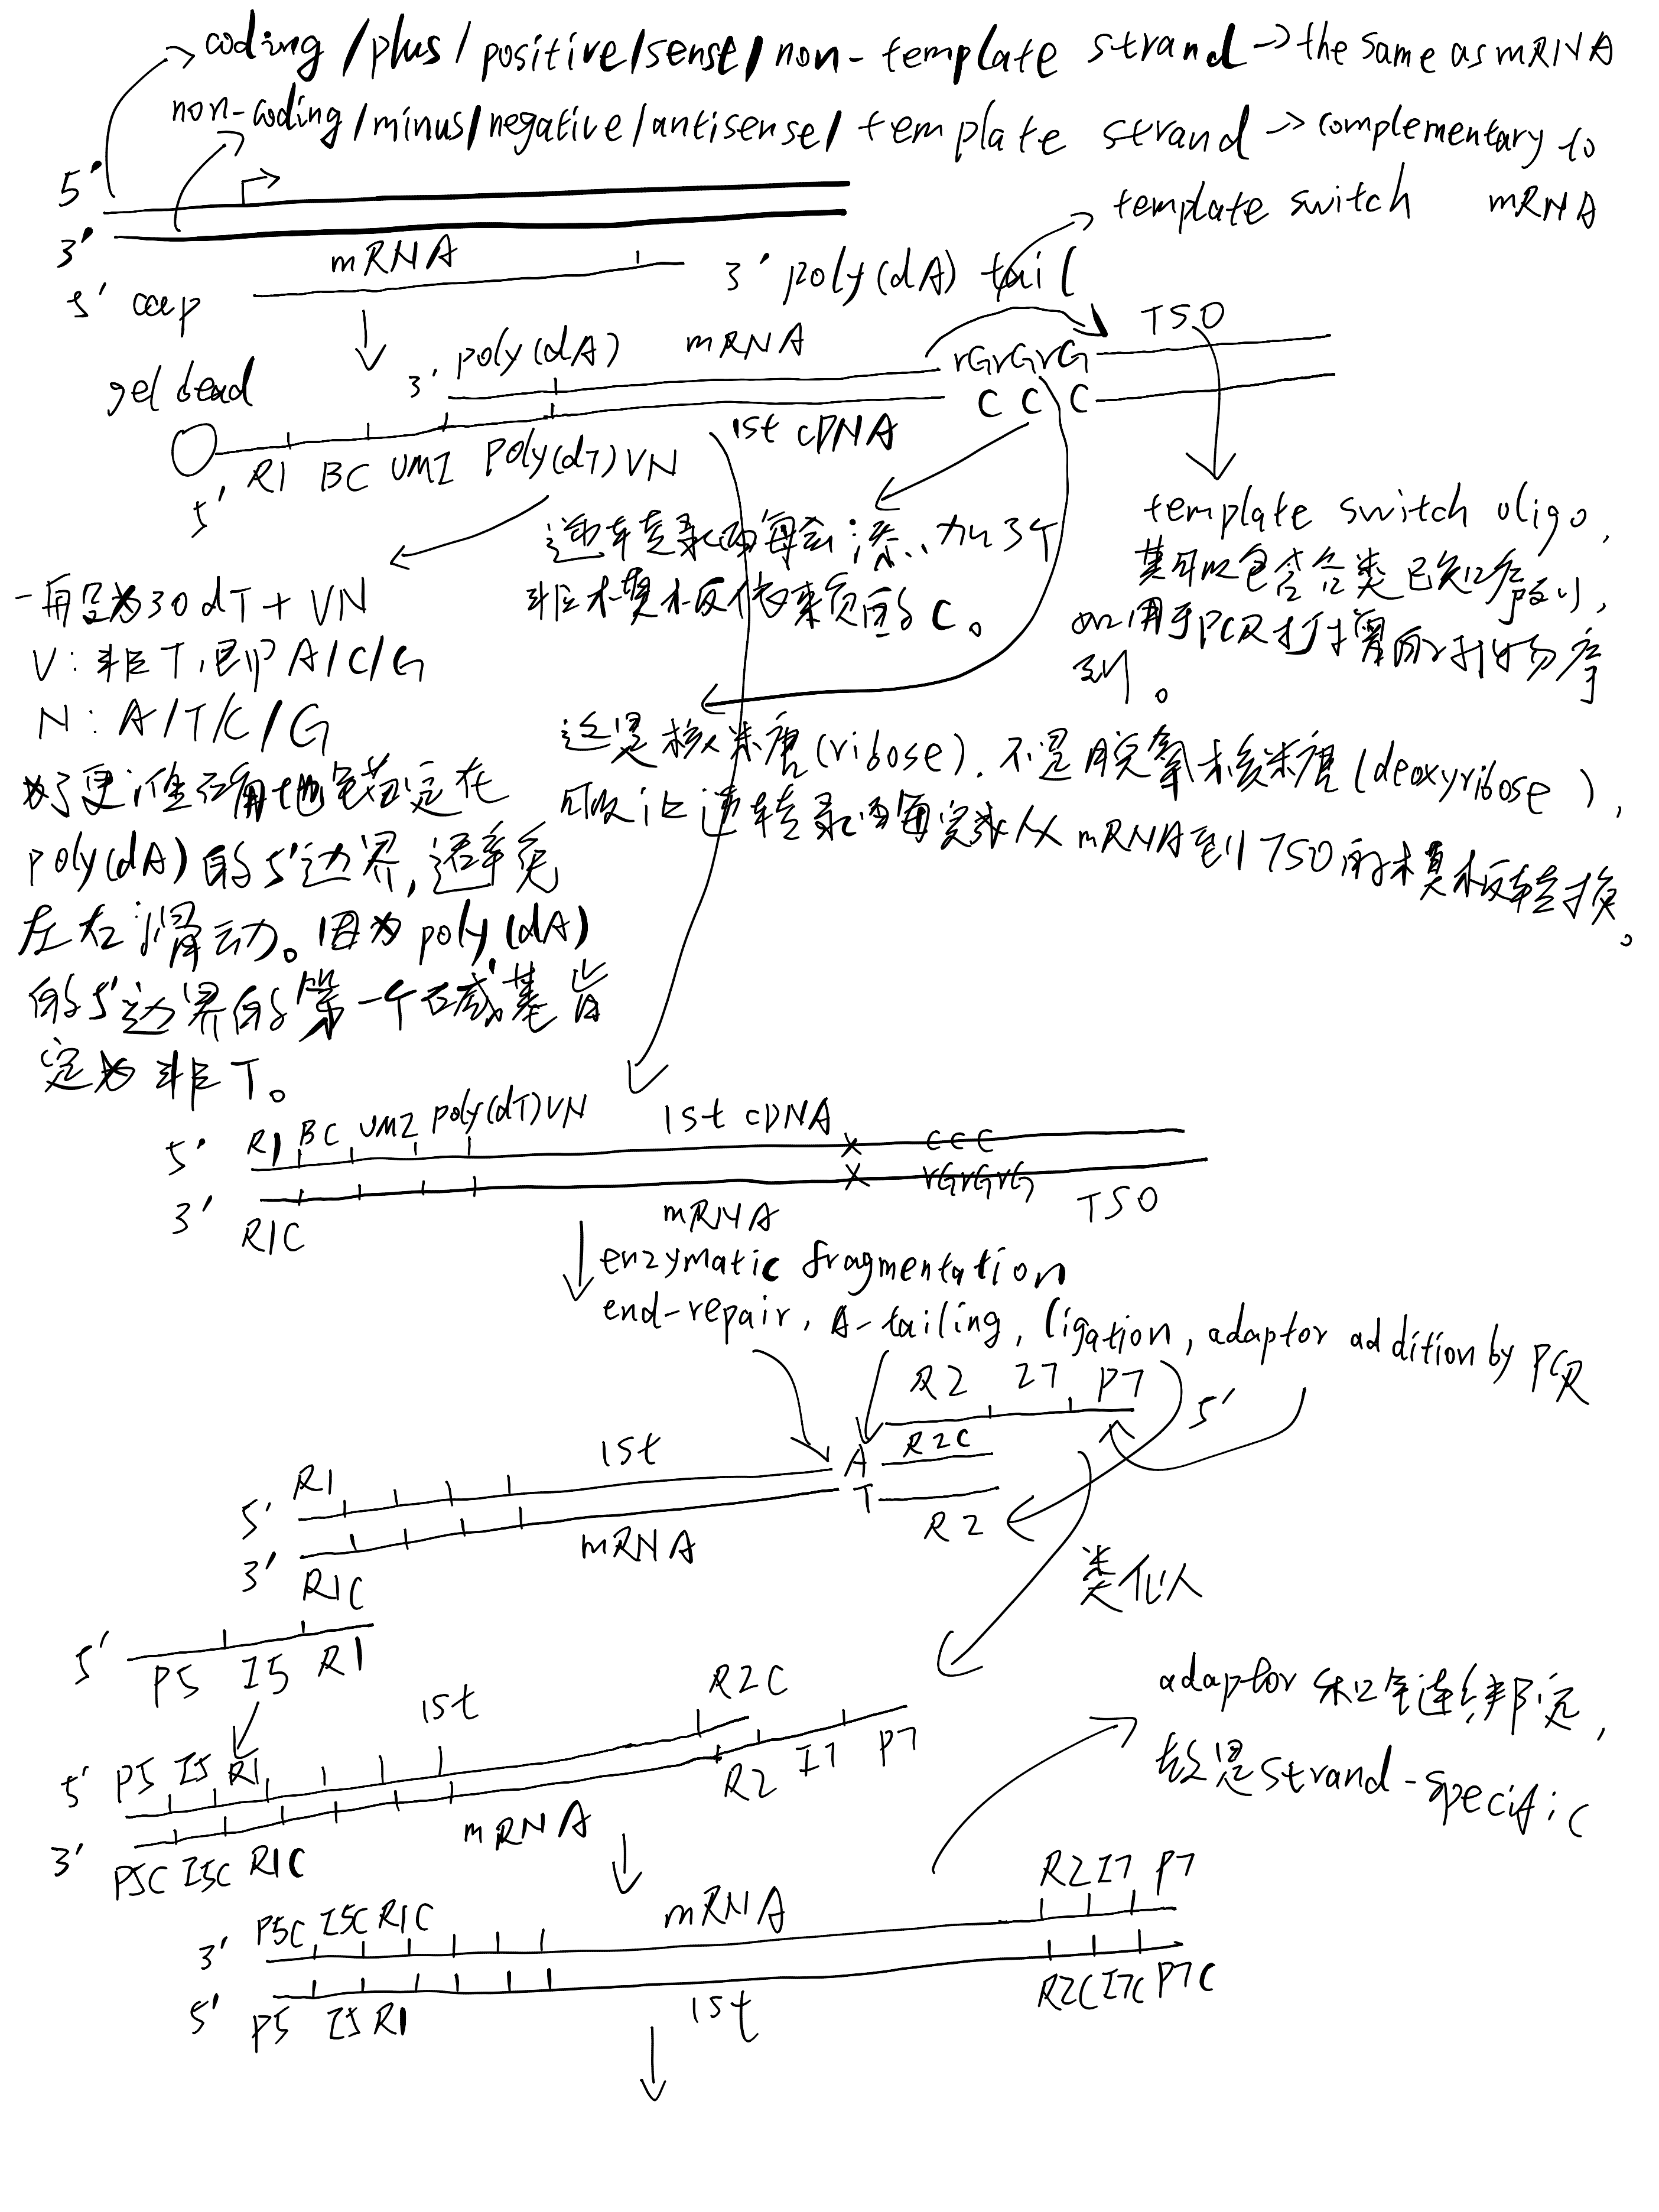
Library construction and sequencing scheme of 3’ transcriptome:
1.2 5’ transcriptome
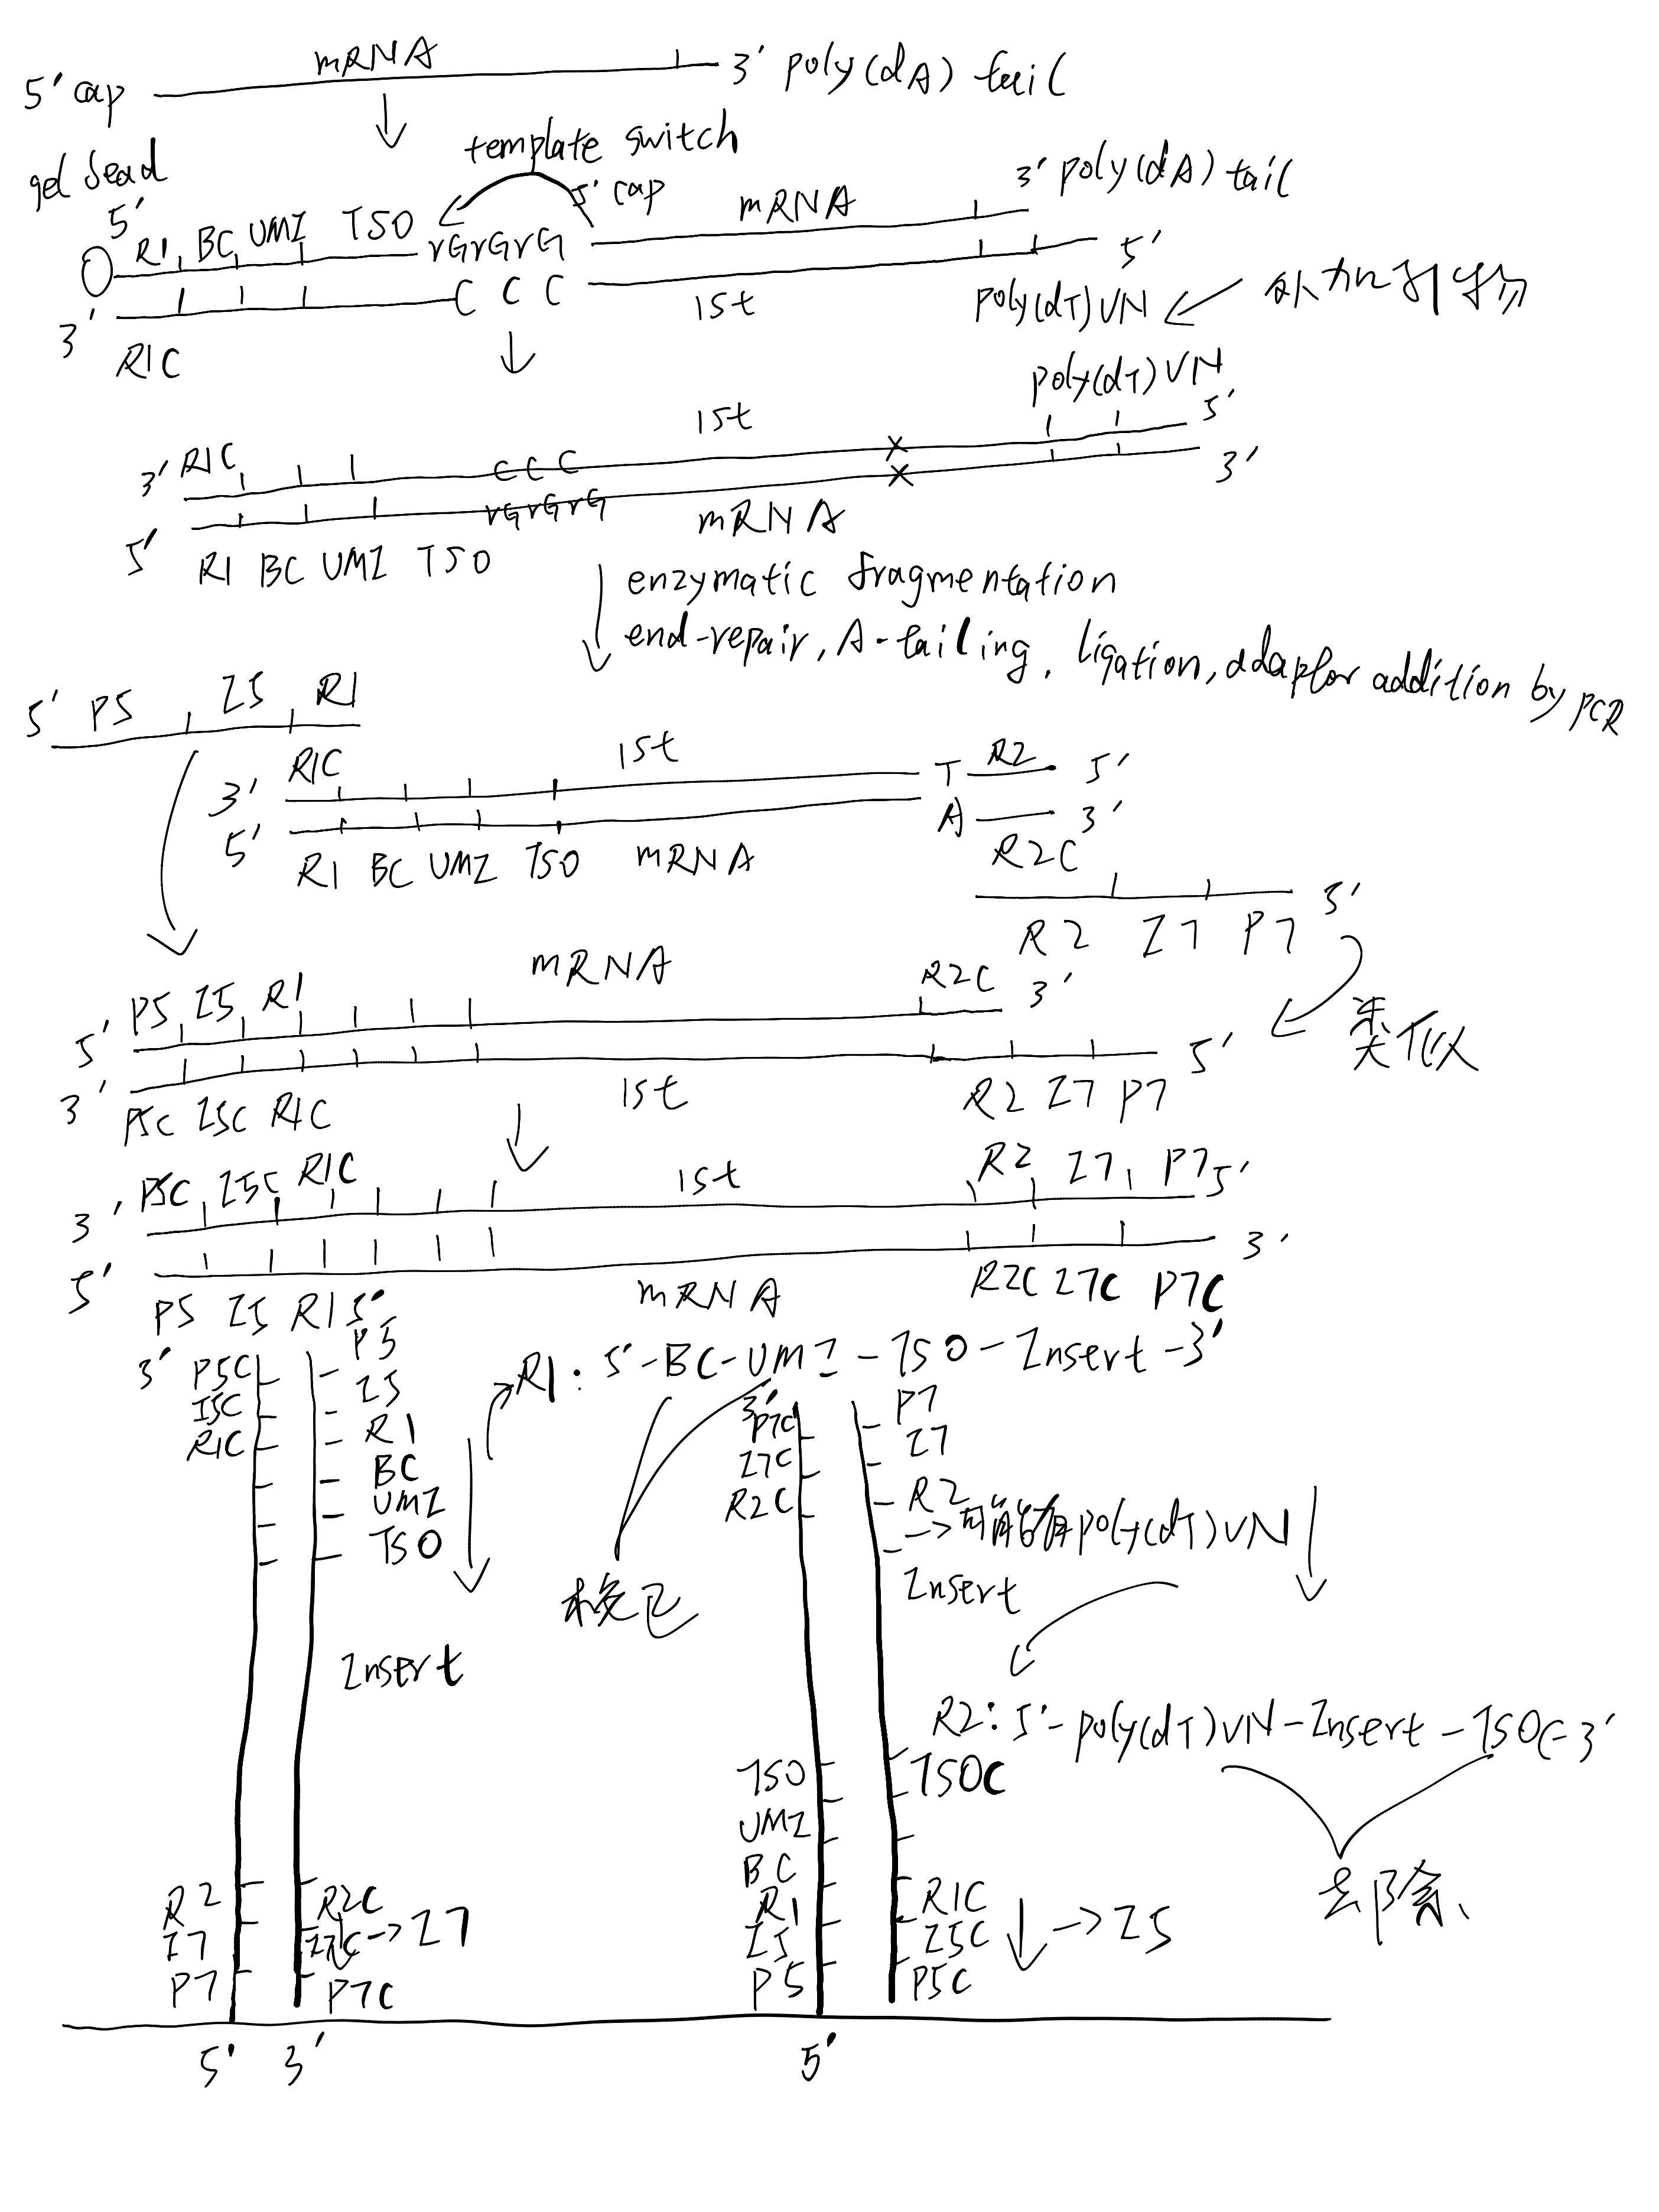
Library construction and sequencing scheme of 5’ transcriptome:
1.3 Quantifying pipelines
1.3.1 MobiVision
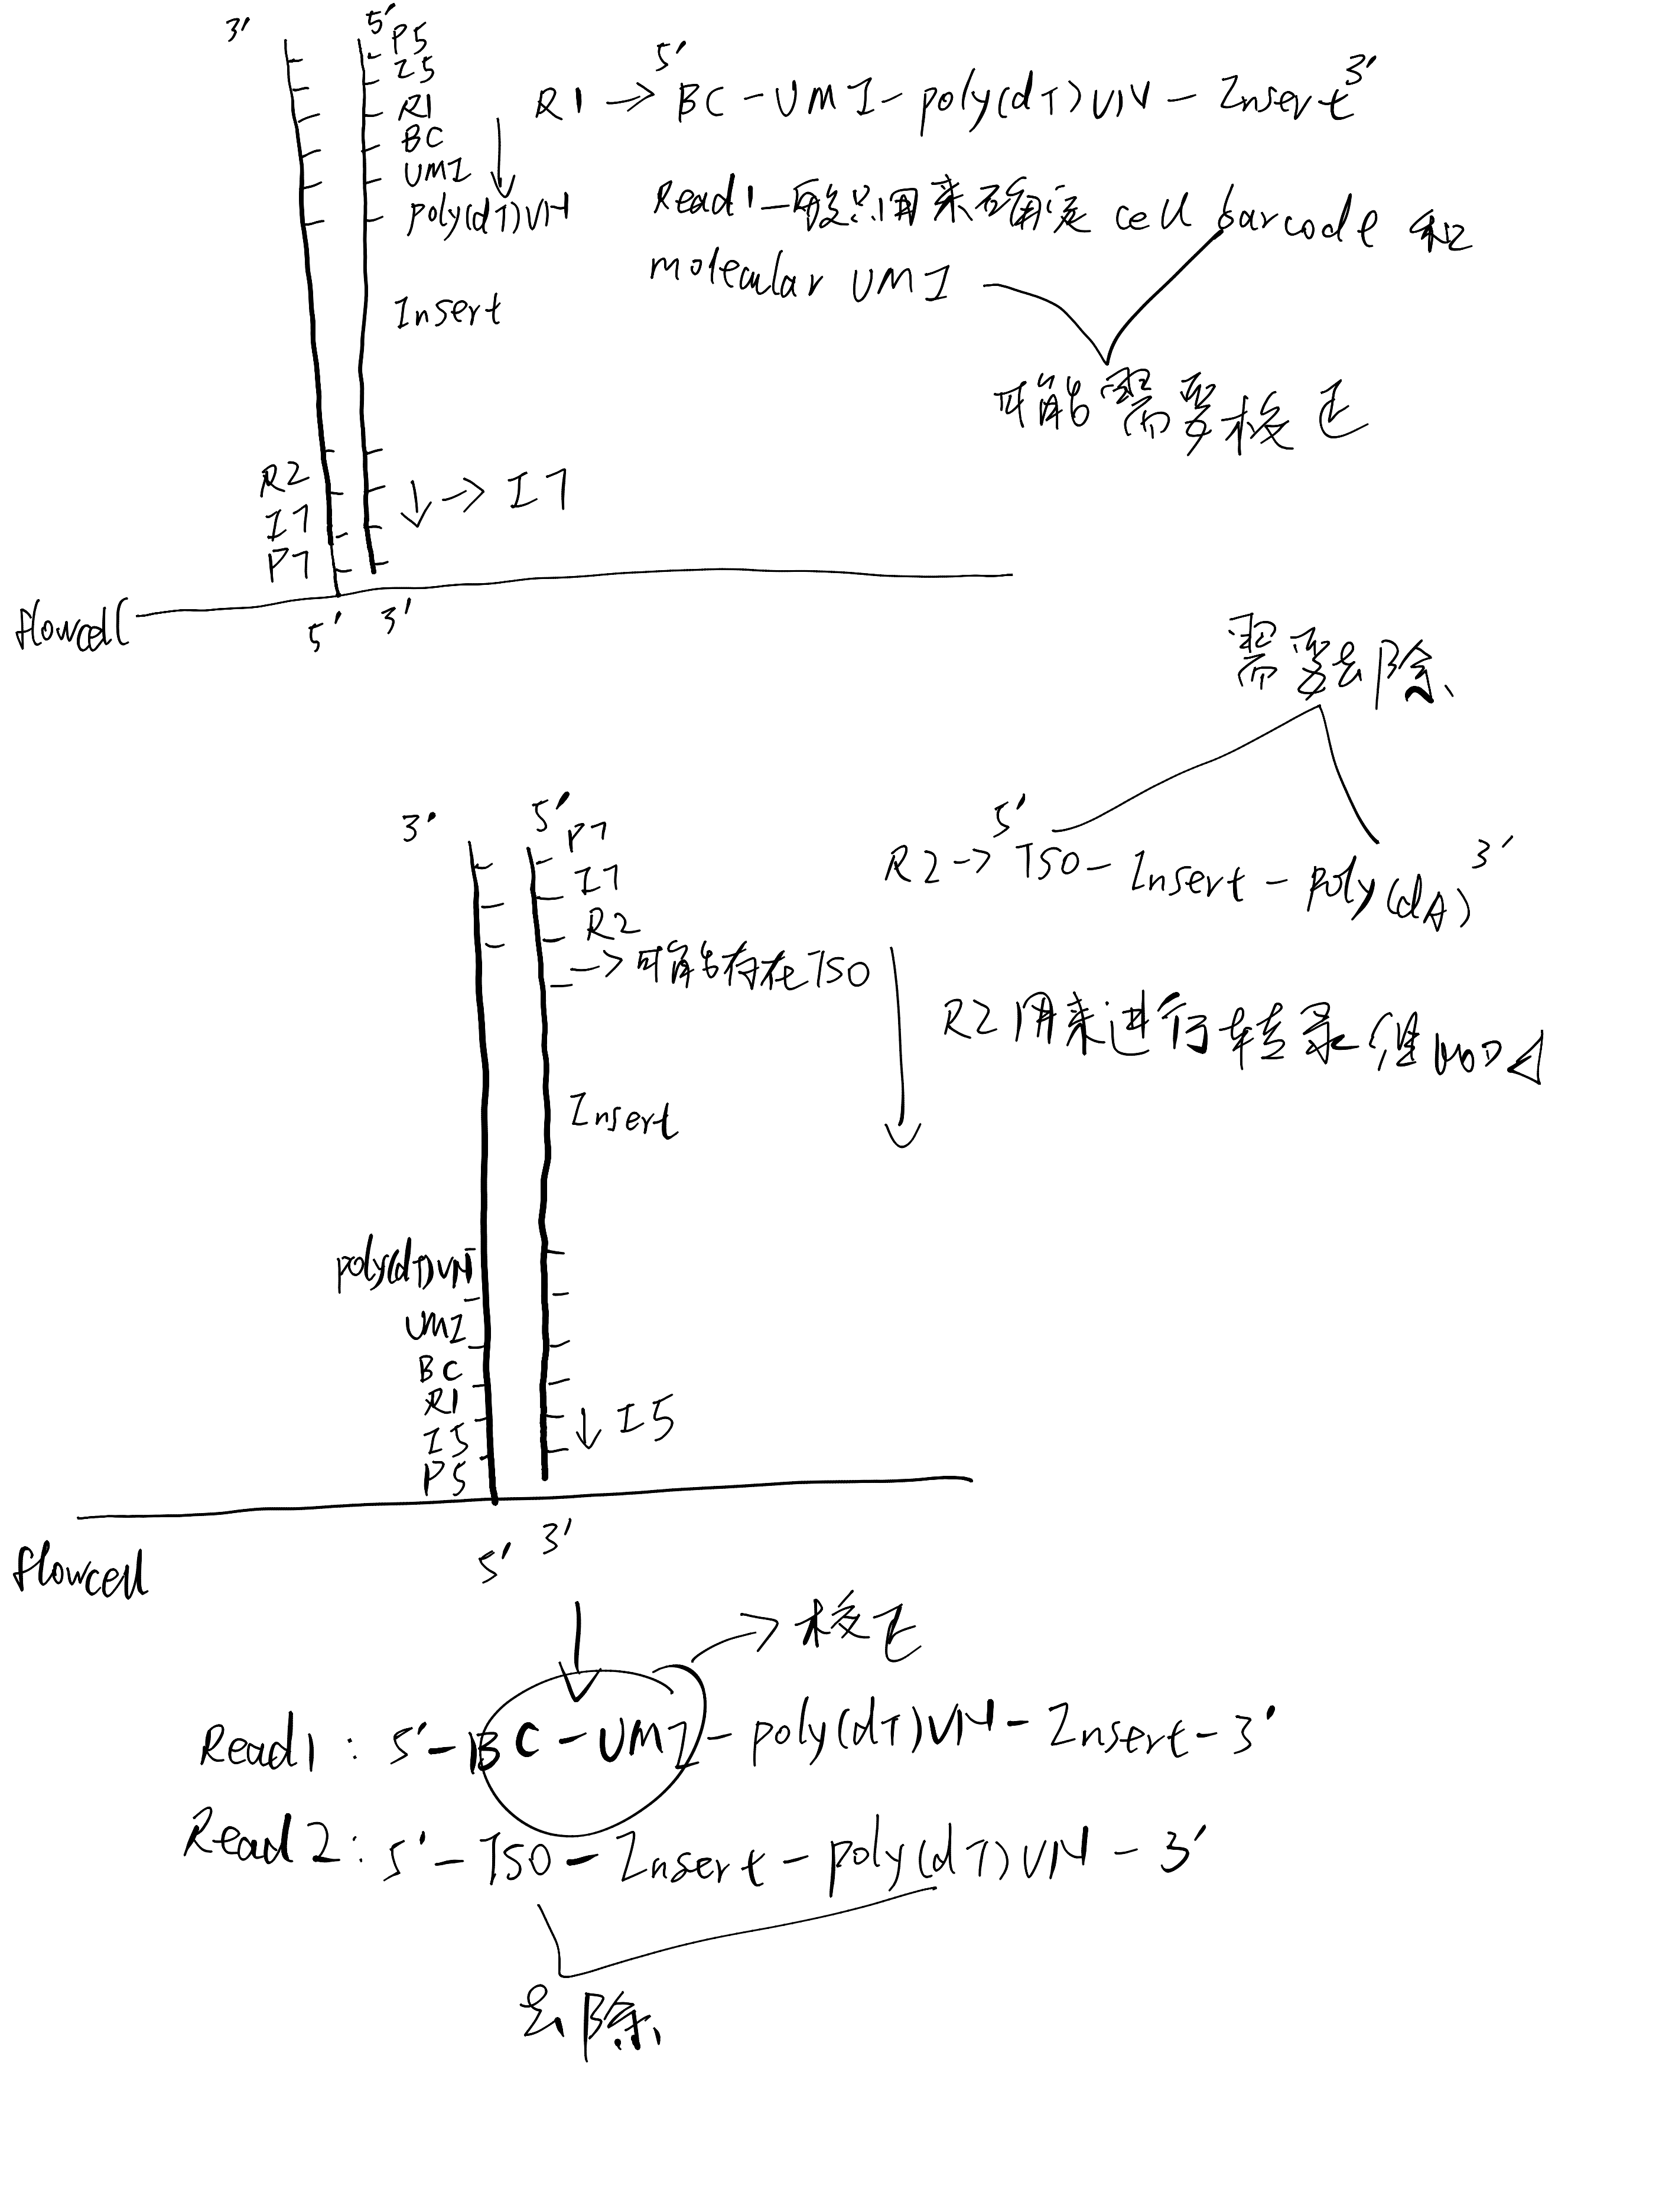
3’ read structure:

5’ read structure:

无论是 3’ 转录组还是 5’ 转录组,Read1 的 5’ 端依次为 cell barcode (20bp) 和 UMI (10bp)。
对于 3’ 转录组,Read2 的 5’ 端可能含有 30bp 的 TSO 序列(
AAGCAGTGGTATCAACGCAGAGTACATGGG);3’ 端可能含有 poly A 序列。对于 5’ 转录组,Read2 的 5’ 端可能含有 poly T 序列;3’ 端可能含有 13bp 的 TSO 反向互补序列(
CCCATATAAGAAA)。
MobiVision 处理的基本流程如下:
- Cell barcode 提取和纠错:将 Read1 中的 cell barcode 与白名单中的 cell barcode 进行比对,保留:
存在于白名单中的 cell barcode。
不存在于白名单中,但与白名单中的 cell barcode 的最小 Hamming distance <= 2 的 cell barcode。根据白名单中的 cell barcode,对 Read1 中的 cell barcode 进行校正。
注:Hamming distance:两个等长字符串在相同位置上不同字符的个数。
- Insert fragment 修剪:根据文库类型,对于 Read2:
去除 3’ 转录组的 5’ 端的 TSO 和 3’ 端的 poly A。
去除 5’ 转录组的 5’ 端的 poly T 和 3’ 端的 TSO 反向互补序列。
去除长度小于 30bp 的插入片段。
- 测序片段比对:
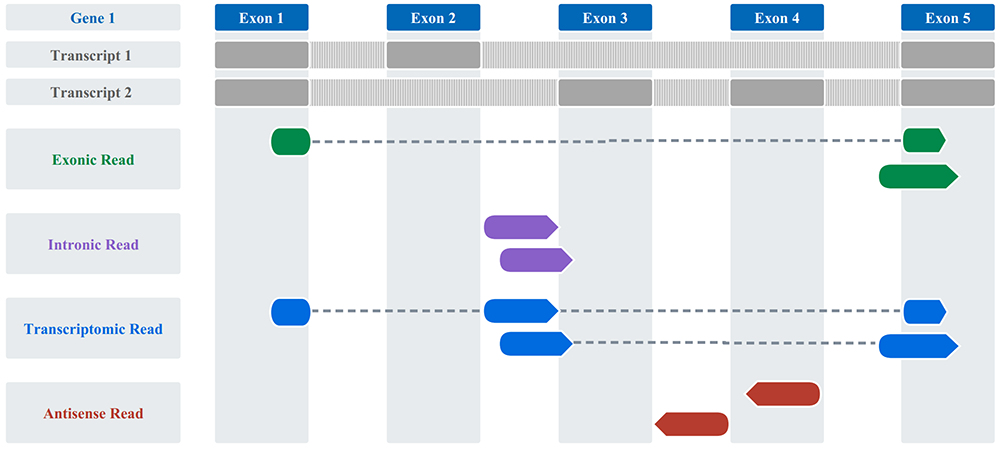
mobivision quantify采用STARsolo进行比对,比对类型包括:
Exonic read:read 有超过 50% 的长度比对到外显子区域。
Intronic read:read 有超过 50% 的长度比对到内含子区域。默认包含内含子(
--intron included)。Intergenic read:read 比对到除外显子和内含子的基因组区域。
Antisense read:在
--intron included模式下,read 有超过 50% 的长度比对到内含子和/或外显子区域的反义链方向;在--intron excluded模式下,read 必须 100% 比对到外显子的反义链方向。Transcriptomic read:在
--intron included模式下,read 有超过 50% 的长度比对到内含子和/或外显子区域;在--intron excluded模式下,read 必须 100% 比对到外显子区域。
对比对到基因组上的测序片段,保留 MAPQ=255(即唯一比对)的比对;只有唯一比对到转录组区域的测序片段,才会进入下游的 UMI 计数。
- UMI 计数:去除:
由同一碱基构成的 UMI。
含有 N 的 UMI。
一个或多个相同的 UMI 比对到同一基因上,UMI count 记为 1;多个相同 UMI 比对到不同基因上,保留比对到同一基因上 UMI 最多的情况,UMI count 记为 1。
两个 UMI 之间仅相差 1 个碱基,且比对到同一基因,则认为这两个 UMI 相同,保留其中一个 UMI,UMI count 记为 1。
基于保留下来的 cell barcode 和 UMI 构建 raw cell by gene matrix。
- 细胞过滤:目前支持 CR2.2 和 EmptyDrops 算法。也可利用 total UMI number per cell 对细胞进行排序,而后通过
--cellnumber INT直接指定需要保留的细胞数。
这一步将生成 filtered cell by gene matrix。
注:在双物种(如人 + 小鼠)混合单细胞实验中利用“比对-计数”方法判定细胞的物种归属:把每条 read 同时比对到人 + 小鼠的合并基因组,根据比对结果给 UMI 打上物种标签,统计每个 cell barcode 下的人 UMI 数和小鼠 UMI 数,按阈值将该 cell barcode 划为“人/小鼠/multiplet(人和小鼠混合细胞)”。
为什么可行?因为人和小鼠的核基因组(10%)/线粒体基因组(15%)差异足够大,对于绝大部分 reads 能够区分其物种来源。
判定标准:对于一个 cell barcode,只有不少于 90% 的 UMI 分子来源于同一物种才会被打上该物种的标签,否则判定为 multiplet。
利用上述 multiplet rate 来间接估计文库中的双胞或多胞情况:若文库中的双胞由随机组合产生,那么人-人为25%,鼠-鼠为25%,人-鼠为50%。则观测到的 multiplet rate = 人-鼠比例,因此总双胞率 = 2 × multiplet rate。理论上,多胞率应该远低于双胞率。
- 输出结果:其中
_flagdone是任务运行成功的 flag 文件;SAMPLEID_outs目录为软件自动生成。
参考:
1.3.2 CellRanger
2 Epigenome
2.1 ATAC
Basic QC metrics:
The number of unique nuclear fragments per cell: 高度依赖于实验方案, 常见分析流程会过滤掉低于 1000/3000/5000 的细胞核.
TSS enrichment score: 一般情况下, 活跃基因的转录起始位点的开放度要高于其 flanking regions, 因此可以将 TSS 中心的信号强度与其 flanking regions 的信号强度进行比较. 对于 snATAC-seq, 这个阈值可设为 > 2/4.
Fraction of reads in peaks (FRiP): > 15%-20%.
Fragment length distribution: < 100-150bp 的 NFRs 峰应明显, ~180-240bp 处的第二个 mono-nucleosome 峰应明显, 之后可能有双/三核小体峰, 大约是 ~200bp 的整数倍.
% mitochondrial reads: snATAC-seq 的目标是细胞核 DNA, 因此线粒体 DNA 的比例应该非常低, e.g., < 5%. 对于缺少线粒体基因组的非模式生物, 可以用其近缘物种的线粒体基因组替代.
其余的还应检查细胞得率、barcode rank plot (knee plot)、library complexity plot、测序质量等指标。
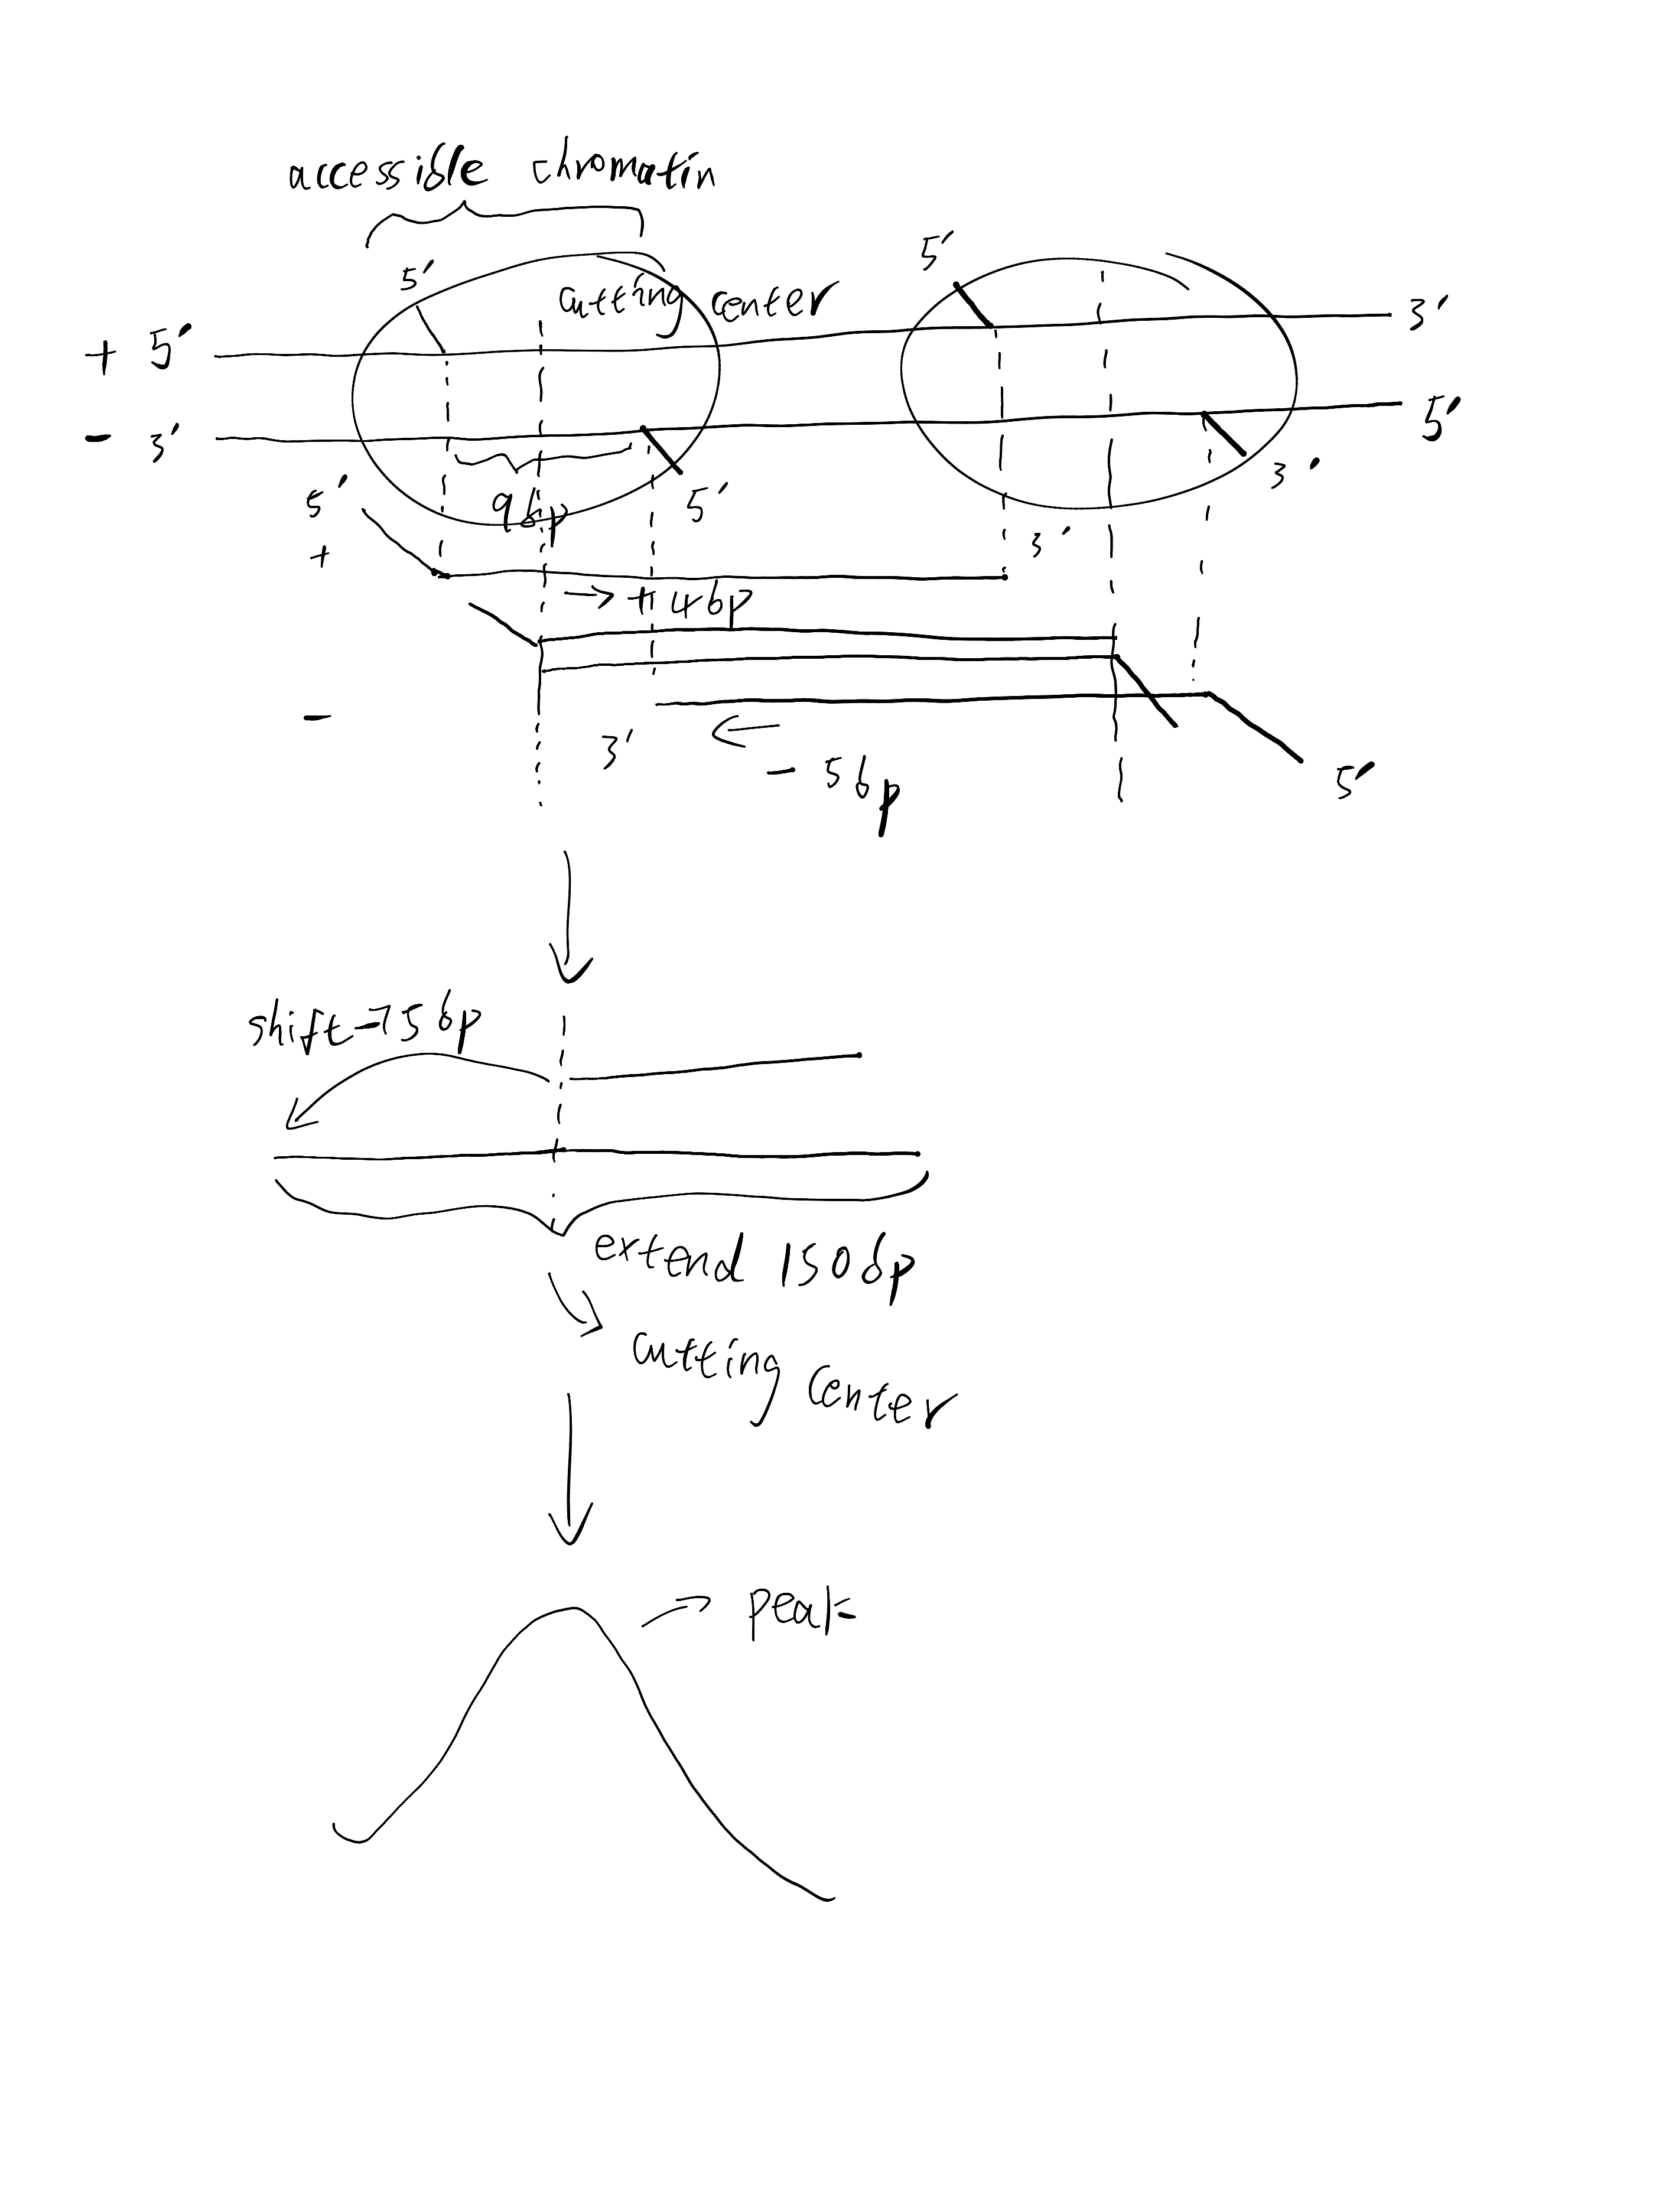
Why does ATAC need to shift fragment positions:
参考:
2.1.1 Aligning pipelines
2.1.1.1 MobiVision
2.1.1.2 CellRanger
2.2 ChIP
参考: